In-depth Study of the AI Industry by Writerbuddy
Writerbuddy analyzes the AI industry: the most visited tools record traffic of more than 24 billion visits.
Artificial intelligence has been a ubiquitous topic over the past year, breaking barriers and redefining several industries in a short period of time. Writerbuddy, is its study “AI Industry Analysis: 50 Most Visited AI Tools and Their 24B+ Traffic Behavior,” analyzes the AI industry and the most visited tools record traffic of more than 24 billion visits.
From September 2022 to August 2023, the top 50 AI tools generated more than 24 billion visits, with an average monthly growth of 236.3 million visits. Of this impressive number, ChatGPT alone accounted for 14 billion visits, comprising a massive 60% of the traffic analyzed. This eye-opening data sets the tone for what is to come as we explore the intricate layers of the AI industry’s digital behavior.
Study methodology.
Using SEMrush, Writerbuddy analyzed over 3,000 AI tools by extracting data from various directories that list these tools. From these, we isolated the 50 most visited tools, which reflect more than 80% of the AI industry traffic during the period studied (September 2022 to August 2023).
This study aims to delve into the behavior of the AI industry, analyzing traffic patterns, demographics, trends and consumer behavior. Here’s a breakdown of the key findings:
- The top 50 AI tools attracted more than 24 billion visits between September 2022 and August 2023.
- ChatGPT led with 14 billion visits, accounting for more than 60% of the traffic analyzed.
- The AI industry recorded an average of 2 billion visits per month over the last year, with an increase to 3.3 billion in the last 6 months.
- The 50 AI tools analyzed experienced a growth rate of 10.7x, with an average monthly increase of 236.3 million visits.
- ChatGPT, Character AI and Google Bard experienced net traffic growth of 1.8 billion, 463.4 million and 68 million visits, respectively.
- Craiyon, MidJourney and Quillbot experienced the largest traffic declines during the period.
- The United States contributed 5.5 billion visits, equivalent to 22.62% of total traffic, while European countries together accounted for 3.9 billion visits.
- AI chatbot tools were the most popular, attracting 19.1 billion visits.
- More than 63% of AI tool users accessed via mobile devices.
- Gender data reveals a disparity: 69.5% are male users, compared to 30.5% female users.
AI industry growth over the last year
Over the past 12 months, the artificial intelligence industry has experienced unprecedented traffic growth. Initially, in September 2022, the top 50 tools analyzed generated 241.8 million visits. The growth rate throughout the study was 10.7x, reaching a staggering peak of 2.8 billion visits in August 2023. This represents a traffic increase of 2.6 billion since the start of the study.
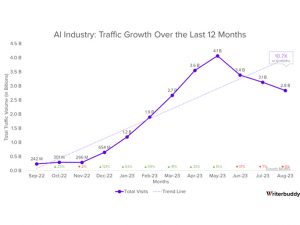
Although there was a 1.2 billion retraction in traffic in May 2023, overall interest remained high, with total growth of 10.7x compared to the previous year. There is speculation that the retraction could be due to regulatory changes, economic attrition, or changes in consumer preferences, including the adoption of mobile apps. Despite this, the analysis suggests that the artificial intelligence bubble has not yet burst.
Net growth of the top 10 AI traffic generators
The artificial intelligence industry is evolving rapidly, with tools gaining and losing traction based on a multitude of factors. This analysis highlights the tools that experienced the largest net increase in traffic volume from September 2022 to August 2023.
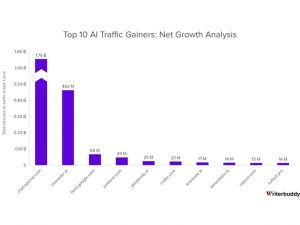
- ChatGPT (Net Growth: 1.8B Visits): Industry leader with 14.6B visits in 10 months and a monthly average of 195.1M.
- Character AI (Net Growth: 463.4M Visits): Designed to create characters, reached 3.8B visits in 12 months and a monthly average of 42.1M.
- Google Bard (Net Growth: 68M Visits): Launched in March 2023, achieved 241.6M visits in 6 months and a monthly average of 11.3M.
- Janitor AI (Net Growth: 48.8M Visits): Excels in NSFW interactions, with net growth of 48.8M in 4 months.
- Perplexity AI (Net Growth: 25.3M Visits): AI educational application with 134.3M visits in 9 months.
- CivitAI (Net Growth: 23.3M Visits): AI creative platform with 177.2M visits in 10 months.
- Leonardo AI (Net Growth: 17.5M Visits): Allows you to create quality visual assets, with 101.6M visits in 9 months.
- ElevenLabs (Net Growth: 15.9M Visits): Offers cutting-edge AI voice, with 88.6M visits in 11 months.
- Capcut (Net Growth: 14.6M Visits): Versatile video editor with 203.8M visits in 12 months.
- Cutout.pro (Net Growth: 14M Visits): Visual design platform with 133.5M visits in 12 months.
Top 5 net losers of AI traffic.
During the study period from September 2022 to August 2023, we identified the top 5 traffic losers in the AI industry.
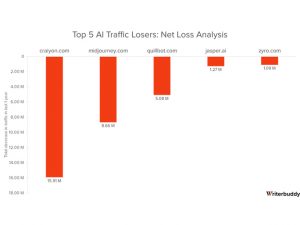
- Craiyon (Net Loss: 15M Visits): Being a free AI image generator, between September 2022 to August 2023, Craiyon.com experienced a reduction of 15 million total visits.
- MidJourney (Net Loss: 8.66M Visits): Another AI imager, which experienced a total loss of 8.66 million visits in the same period.
- Quillbot (Net Loss: 5M Visits): Being in the AI writing category decreased by 5 million during the yearly study.
- Jasper (Net Loss: 1.27M Visits): Being one of the first AI writing tools on the market experienced a total drop of 1.27M visits.
- Zyro (Net Loss: 1.09M Visits): Dedicated to building websites, experienced a total loss of 1.09 million visits.
The study points out that the net loss of visits experienced by these artificial intelligence providers are related to the emergence of new, more competent tools and the natural evolution of the industry.
Top countries with the highest number of users
In the last year, the United States leads in interest in artificial intelligence, generating 5.5 billion visits, 22.62% of global traffic. India follows with 2.1 billion visits (8.52%), highlighting its strong technology market. Indonesia, the Philippines and Brazil follow with similar levels of interest.

China, despite its huge population, does not figure in the top 20 countries due to regulation and development of AI tools in its native language. Europe, Australia and Canada show lag in AI investment and adoption, attributed to regulatory concerns and a study suggesting lack of compliance with EU regulations.
Usage by category and consumer behavior
Next, the study reveals the varied usage of AI categories and consumer behavior across industry tools identifying areas for growth and improvement.
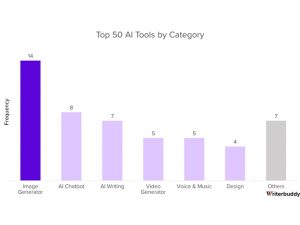
The graphical distribution of AI tools in the industry provides insight into the areas currently gaining traction. Among the top 50 most visited tools, the “Image Generator” category leads with 14 tools, followed by “AI Chatbots” with 8 and “AI Script Generator” with 7. As for the “Video Generator” and “Voice & Music” categories, both have 5 tools each, while “Design” has 4 and “Other” has 7 tools.
One of the most interesting findings is that, despite their smaller number, AI chatbots generate the most traffic, with a staggering 19.1 billion visits. This dominance is explained by the versatility of tools like ChatGPT and Google Bard, used for writing, education, translation, analytics and more.
The AI writing category follows closely with 1.7 billion views, highlighting the demand for specialized tools. Image generators are also popular, generating 1.6 billion views, followed by video generators and voice and music tools with 0.4 billion each.
The Data Science category is the next largest, with 0.3 billion visits, while the other categories combined generated 0.7 billion. This analysis reveals the importance of chatbots and scripting tools in today’s AI landscape.
OpenAI’s ChatGPT dominates the AI Chatbots category with an impressive 76.31% of total visits, followed by Character AI with 19.86%. Competitors such as Google Bard, Janitor AI, Perplexity AI, You.com, Crushon AI and Personal AI each generated less than 2%. The fragmented distribution indicates intense competition in the quest for a prominent position.
Tools by Average Duration of Use and Bounce Rate
In terms of average duration of use, tools such as Character AI, Dezgo and Janitor AI stand out, captivating users for more than 25 minutes per visit, suggesting an immersive experience and more comprehensive features. The industry average is 12 minutes and 34 seconds.

On the other hand, in bounce rate, Google Bard, Crushon and Opus lead with low rates, indicating a solid initial impression and high quality of user experience. While ChatGPT and Jasper are close to the average, others show room for improvement in this aspect, suggesting possible areas for development in usability.
Traffic Origin, Device and Gender
In the following analysis, the study explores AI audience demographics in depth, examining Traffic Origin, Device and Gender. This exploration aimed to refine our engagement strategies, ensuring personalized interactions and an improved understanding of AI’s diverse user base for more effective optimization.
AI Tools by Traffic Channel
80.53% of AI tools users access directly, indicating a well-established user base or frequent visitors. Organic search accounts for 11.40%, while referrals make up 6.73%, highlighting partnerships or recommendations. Despite the rise of AI in social media, social organic traffic is only 1.02%, possibly indicating an area of opportunity. Paid search and other contribute minimally, at 0.21% and 0.12%, respectively.
AI Tools Users by Device
63.20% of users access AI tools via mobile devices, underscoring the importance of responsive designs and applications in the sector. Desktop users make up 36.80%, highlighting the need for mobile optimization. This highlights the continued trend towards mobile centricity in technology and the need for mobile-friendly interfaces and functionality by AI tool developers.
AI Tools by Gender
The gender disparity in the use of AI tools is notable: 69.5% of users are male, while 30.5% are female. This highlights a gender gap in the use of these AI tools, possibly stemming from underlying differences in technology roles. This pronounced difference could prompt industry leaders to investigate the underlying causes, whether social, educational or promotional barriers.
Top 10 AI tools by number of visits
The analysis of the Top 10 AI Tools reveals fascinating trends in user behavior. ChatGPT dominates with 14.6 billion visits, evidencing its global impact. Character AI stands out with long sessions, while QuillBot remains solid despite a decline.
Midjourney, a leader in image generation, shows an even distribution across devices. Hugging Face leads in Data Science, followed by Google Bard, which is quickly gaining traction. Novel AI excels in writing, and JanitorAI surprises with extended sessions. Civitai impresses with double-long session times and low bounce, pointing to an attractive and functional interface. Here are the top 10 AI tools based on the number of visits from September 2022 to August 2023.
- ChatGPT:
– Visits: 14.6 billion
– Top usage in the U.S., India and Brazil.
– 58% of audience accesses via mobile devices.
– Gender distribution: 74.16% male.
– Average session time: almost 10 minutes.
– Potential for improvement in bounce rate. - Character AI:
– Visits: 3.8 billion.
– Average session time: almost 30 minutes.
– Gender distribution: 59.87% male.
– Excels in engagement.
– Mainly used in the United States, Indonesia and the Philippines.
– Bounce rate: 60.38%. - QuillBot:
– Visits: 1.1 billion
– Average session time: 20 minutes and 54 seconds.
– Gender distribution: 59.85% male.
– Top users in the Philippines, United States and India.
– Bounce rate: 75.20%. - Midjourney:
– Visits: 500.4 million.
– Average session time: 11 minutes and 43 seconds.
– Gender distribution: 92.19% male.
– Equal usage between desktop and mobile devices.
– Top users in the United States, Brazil, India and the United Kingdom.
– Bounce rate: 61.64%. - Hugging Face:
– Visits: 316.6 million
– Average session time: 11 minutes and 2 seconds.
– Gender distribution: 84.48% male.
– Equal usage between desktop and mobile devices.
– Mostly used in the United States and Japan.
– Bounce rate: 63.46%. - Google Bard:
– Visits: 241.6 million
– Average session time: 10 minutes.
– Gender distribution: 69.14% male.
– 67% access via mobile devices.
– Strong usage in India, United States and United Kingdom.
– Bounce rate: 26.59%. - Novel AI:
– Visits: 238.7 million
– Average session time: almost 14 minutes.
– Gender distribution: 91.67% male.
– Mostly used in the United States, Japan and Indonesia.
– Bounce rate: 62.65%. - CapCut:
– Visits: 203.8 million
– Average session time: 9 minutes and 45 seconds.
– Balanced gender distribution.
– Most access via desktop (61%).
– Bounce rate slightly above average. - JanitorAI:
– Visits: 192.4 million.
– Average session time: 26 minutes and 53 seconds.
– Mostly accessed through mobile devices (96%).
– Balanced gender distribution.
– Leads in traffic from the United States, followed by Brazil and Malaysia.
– Bounce rate: 49.21%. - Civitai:
– Visits: 177.2 million
– Average session time: 23 minutes and 19 seconds.
– Most access via mobile devices (58%).
– Gender distribution: 88.79% male.
– Mainly used in the United States, Japan and Indonesia.
– Bounce rate slightly below average.
Final Thoughts on the AI Industry
Concluding this study, the artificial intelligence (AI) industry shows accelerating growth, despite a decline of 1.2 billion visits after the peak around May. Writerbuddy anticipates continued growth driven by adoption and innovation, with key leaders such as Open AI’s ChatGPT and Google’s Bard at the forefront. Bard, recently launched in March with geo-restrictions, promises more breakthroughs. At this early stage, expect more disruption and market changes in the future.